When the stock market closed for trading on July 29, 2022, the S&P 500 rallied 7.75% for the month of July while ending down 12.87% YTD. So, by the numbers, the market rallied enough to claw its way back from the worst first half performance in decades and out of Bear Market territory.
Last month we suggested, “The better news is there will be good days ahead if history serves as any sort of decent guide (and we believe it does).” And, we were not wrong.
Meanwhile, some key events took place in July that dramatically changed the economic and market landscape, and quite a bit of technical repair has occurred.
Inflation Update
The July release of the June PCE index, which captures inflation (or deflation) across a wide range of consumer expenses and changes in consumer behavior, registered another increase, which surprised some. The increase was across the board, even if we excluded food and energy.
After this reported increase (which is backward-looking), crude oil prices continued to drop throughout the month of July. Starting July at around $108 a barrel, crude is currently trading just under $90 a barrel at the time of this writing (August 8, 2022). It cannot be stated strongly enough how big of a lever this is for the global economy. Relief is beginning to show up at the pump, which in turn has provided a lift to sentiment within the equities market. If lower crude prices result in lower gasoline prices, this can dramatically lower the headline inflation numbers in the coming months.
Additionally, in the last days of July, an UN-brokered agreement was reached to allow Ukraine to begin shipping the Wheat that’s been trapped in its port. This is welcomed news, but the food crisis we were worried about is still on the table, given that higher fertilizer prices have resulted in farmers using 15-20% less fertilizer in many locations, reducing crop yields in the coming year. The damage that’s been done will take time to heal. Wheat prices dropped another 14.5% in July on relief over the Ukraine situation, which again helps the near-term inflation outlook and sentiment in general.
Elsewhere US GDP printed another negative number quarter over quarter, so by the textbook definition, the US is in recession. While two-quarters of slowing growth meets the barebones technical definition of recession, given the strength in many parts of the economy, it’s not clear that the National Bureau of Economics (NBER) would declare this a recession – it’s a strange mix of variables. So, outside of that definition, you would not be alone in wondering how that’s possible with the job market (still) remaining decidedly strong even in the face of the first wave of layoffs we’ve seen announced.
To summarize: NBER is the body that officially calls for recession and uses many more factors than just two-quarters of negative GDP growth. They are also notorious for declaring the recession after the recovery has already begun and the markets have already begun to have their relief rally.
The State of the Market
Overall, 87% of the companies in the S&P 500 have reported actual results for Q2 2022 in this latest earnings season to date. Of these companies, 75% have reported actual EPS (earnings per share) above estimates, which has certainly placated some of the concerns going into this quarter. Earnings estimates have been coming down over the last couple of months, and companies were able to meet them – reality and expectations met each other in a coordinated dance, and market participants were happy.
On a technical level, the broad US market needs to rally just another 3.69% to be above the 200-day moving average, a widely-followed sentiment indicator.
While many strategists and news outlets have quickly labeled this latest rally as just another Bear Market rally (inferring that we will not be seeing higher highs), we are not so sure this time. Anecdotally, references to “Bear Market Rally” within news articles were at a decade-high in the month of June. We can’t know the future, and certainly, there is a lot wrong currently, but we have to be humble and what we do know is that quite often, setups like this lead to higher prices.
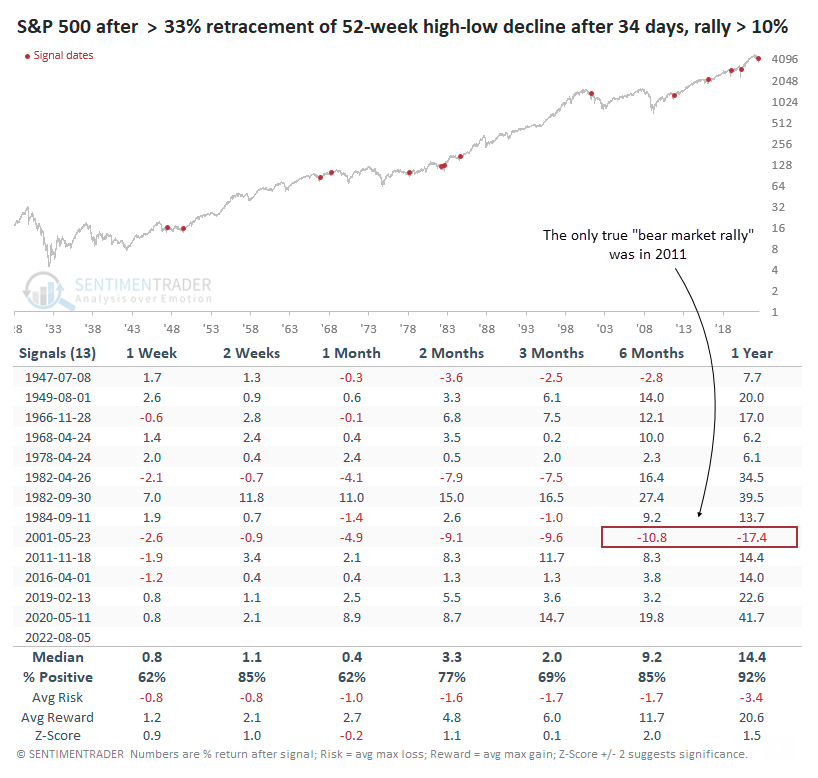
As of Friday, the rally has gone on for 34 trading days. Measuring from the S&P 500’s last 52-week high to 52-week low, the index retraced more than 43% of its decline and stood more than 13% above its low. Similar to 2020, this is not what we typically see during a bear market.
The table below shows every rally from a 52-week low when the S&P 500 retraced at least a third of its decline over 34 days. As part of the screening process, for these periods to also be included, the index had to be at least 10% higher than its low.
You’ll notice since 1947, within the fourteen different periods where this strong of a retracement occurred, only one period led to losses in the following months. And the market was often much higher in all of the other periods.
While no one indicator ever serves as a magic bullet or crystal ball, we do find this development noteworthy, especially combined with the strength we’ve seen relative to the 200-day moving average. Furthermore, against the backdrop of the lower prices we’ve seen in “fuel and food” markets over the last month, we are cautiously optimistic, especially as Growth companies like Amazon, Apple, and Google have begun to spring back to life.
That said, we are monitoring the markets and portfolios, and we continue to be ready to make changes as necessary. As always, if you have any questions about your portfolio, feel free to contact us anytime. We’re here for you.